
Page 775 - Demo
P. 775
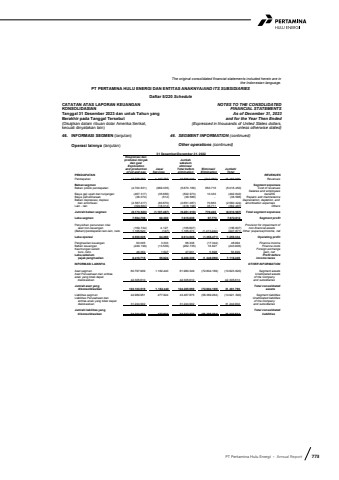
PT Pertamina Hulu Energi %u2022 Annual Report 773The original consolidated financial statements included herein are in the Indonesian language.PT PERTAMINA HULU ENERGI DAN ENTITAS ANAKNYA/AND ITS SUBSIDIARIESDaftar 5/220 ScheduleCATATAN ATAS LAPORAN KEUANGANKONSOLIDASIANTanggal 31 Desember 2023 dan untuk Tahun yang Berakhir pada Tanggal Tersebut(Disajikan dalam ribuan dolar Amerika Serikat,kecuali dinyatakan lain)NOTES TO THE CONSOLIDATEDFINANCIAL STATEMENTSAs of December 31, 2023and for the Year Then Ended(Expressed in thousands of United States dollars,unless otherwise stated)46. INFORMASI SEGMEN (lanjutan) 46. SEGMENT INFORMATION (continued)Operasi lainnya (lanjutan) Other operations (continued) 31 Desember/December 31, 2022 Eksplorasi dan produksi minyak Jumlahdan gas/ sebelumExploration eliminas/and production Jasa/ Total before Eliminasi/ Jumlah/of oil and gas Services elimination Elimination Total PENDAPATAN REVENUESPendapatan 15.728.262 1.167.787 16.896.049 (712.650) 16.183.399 RevenuesBeban segmen Segment expensesBeban pokok pendapatan (4.700.831) (969.335) (5.670.166) 653.716 (5.016.450) Cost of revenuesSalaries and employeesBiaya gaji upah dan tunjangan (467.317) (35.656) (502.973) 10.333 (492.640) benefitsBiaya pemeliharaan (38.074) (512) (38.586) - (38.586) Repairs and maintenanceBeban depresiasi, deplesi Depreciation, depletion, anddan amortisasi (2.567.417) (83.670) (2.651.087) 70.663 (2.580.424) amortization expensesLain - lain (399.884) (18.314) (418.198) 35.711 (382.487) OthersJumlah beban segmen (8.173.523) (1.107.487) (9.281.010) 770.423 (8.510.587) Total segment expensesLaba segmen 7.554.739 60.300 7.615.039 57.773 7.672.812 Segment profitPenyisihan penurunan nilai Provision for impairment ofaset non-keuangan (169.734) 4.127 (165.607) - (165.607) non-financial assets(Beban)/pendapatan lain-lain, neto 1.165.520 (147) 1.165.373 (1.413.244) (247.871) Other (expense)/income, netLaba operasi 8.550.525 64.280 8.614.805 (1.355.471) 7.259.334 Operating profitPenghasilan keuangan 63.005 3.333 66.338 (17.344) 48.994 Finance incomeBeban keuangan (249.199) (13.536) (262.735) 18.827 (243.908) Finance costsKeuntungan selisih Foreign exchange kurs, neto 46.384 1.547 47.931 5.898 53.829 gain, netLaba sebelum Profit beforepajak penghasilan 8.410.715 55.624 8.466.339 (1.348.090) 7.118.249 income taxesINFORMASI LAINNYA OTHER INFORMATIONAset segmen 60.797.909 1.182.440 61.980.349 (72.804.169) (10.823.820) Segment assetsAset Perusahaan dan entitas Unallocated assetsanak yang tidak dapat of the Companydialokasikan 42.305.610 - 42.305.610 - 42.305.610 and subsidiariesJumlah aset yang Total consolidateddikonsolidasikan 103.103.519 1.182.440 104.285.959 (72.804.169) 31.481.790 assetsLiabilitas segmen 42.989.951 477.924 43.467.875 (58.389.264) (14.921.390) Segment liabilitiesLiabilitas Perusahaan dan Unallocated liabilitiesentitas anak yang tidak dapat of the Companydialokasikan 31.244.902 - 31.244.902 - 31.244.902 and subsidiariesJumlah liabilitas yang Total consolidateddikonsolidasikan 74.234.853 477.924 74.712.777 (58.389.264) 16.323.513 liabilities
