
Page 774 - Demo
P. 774
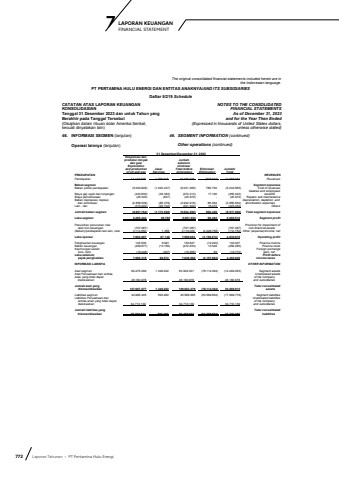
772 Laporan Tahunan %u2022 PT Pertamina Hulu EnergiLAPORAN KEUANGAN 7 FINANCIAL STATEMENTThe original consolidated financial statements included herein are in the Indonesian language.PT PERTAMINA HULU ENERGI DAN ENTITAS ANAKNYA/AND ITS SUBSIDIARIESDaftar 5/219 ScheduleCATATAN ATAS LAPORAN KEUANGANKONSOLIDASIANTanggal 31 Desember 2023 dan untuk Tahun yang Berakhir pada Tanggal Tersebut(Disajikan dalam ribuan dolar Amerika Serikat,kecuali dinyatakan lain)NOTES TO THE CONSOLIDATEDFINANCIAL STATEMENTSAs of December 31, 2023and for the Year Then Ended(Expressed in thousands of United States dollars,unless otherwise stated)46. INFORMASI SEGMEN (lanjutan) 46. SEGMENT INFORMATION (continued)Operasi lainnya (lanjutan) Other operations (continued) 31 Desember/December 31, 2023 Eksplorasi danproduksi minyak Jumlahdan gas/ sebelumExploration eliminas/and production Jasa/ Total before Eliminasi/ Jumlah/of oil and gas Services elimination Elimination TotalPENDAPATAN REVENUESPendapatan 14.147.008 1.258.318 15.405.326 (836.942) 14.568.384 RevenuesBeban segmen Segment expensesBeban pokok pendapatan (5.000.828) (1.020.437) (6.021.265) 786.700 (5.234.565) Cost of revenuesSalaries and employeesBiaya gaji upah dan tunjangan (433.830) (38.383) (472.213) 17.190 (455.023) benefitsBiaya pemeliharaan (45.345) (627) (45.972) - (45.972) Repairs and maintenanceBeban depresiasi, deplesi Depreciation, depletion, anddan amortisasi (2.856.539) (86.379) (2.942.918) 86.064 (2.856.854) amortization expensesLain - lain (315.222) (26.702) (341.924) 16.472 (325.452) OthersJumlah beban segmen (8.651.764) (1.172.528) (9.824.292) 906.426 (8.917.866) Total segment expensesLaba segmen 5.495.244 85.790 5.581.034 69.484 5.650.518 Segment profitPenyisihan penurunan nilai Provision for impairment ofaset non-keuangan (707.087) - (707.087) - (707.087) non-financial assets(Beban)/pendapatan lain-lain, neto 3.114.650 1.356 3.116.006 (3.228.758) (112.752) Other (expense)/income, netLaba operasi 7.902.807 87.146 7.989.953 (3.159.274) 4.830.679 Operating profitPenghasilan keuangan 145.636 6.991 152.627 (12.220) 140.407 Finance incomeBeban keuangan (459.677) (13.156) (472.833) 13.548 (459.285) Finance costsKeuntungan selisih Foreign exchange kurs, neto (19.448) (407) (19.855) 83 (19.772) gain, netLaba sebelum Profit beforepajak penghasilan 7.569.318 80.574 7.649.892 (3.157.863) 4.492.029 income taxesINFORMASI LAINNYA OTHER INFORMATIONAset segmen 62.476.099 1.346.202 63.822.301 (78.114.364) (14.292.063) Segment assetsAset Perusahaan dan entitas Unallocated assetsanak yang tidak dapat of the Companydialokasikan 45.180.978 - 45.180.978 - 45.180.978 and subsidiariesJumlah aset yang Total consolidateddikonsolidasikan 107.657.077 1.346.202 109.003.279 (78.114.364) 30.888.915 assetsLiabilitas segmen 44.996.405 593.480 45.589.885 (63.589.664) (17.999.779) Segment liabilitiesLiabilitas Perusahaan dan Unallocated liabilitiesentitas anak yang tidak dapat of the Companydialokasikan 34.710.139 - 34.710.139 - 34.710.139 and subsidiariesJumlah liabilitas yang Total consolidateddikonsolidasikan 79.706.544 593.480 80.300.024 (63.589.664) 16.710.360 liabilities
