
Page 667 - Demo
P. 667
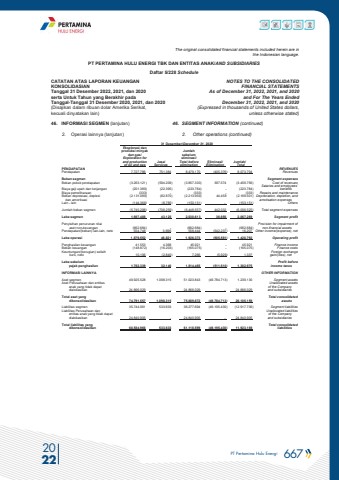
PT Pertamina Hulu Energi 667 2022The original consolidated financial statements included herein are in the Indonesian language.PT PERTAMINA HULU ENERGI TBK DAN ENTITAS ANAK/AND SUBSIDIARIES Daftar 5/228 ScheduleCATATAN ATAS LAPORAN KEUANGANKONSOLIDASIANTanggal 31 Desember 2022, 2021, dan 2020serta Untuk Tahun yang Berakhir padaTanggal-Tanggal 31 Desember 2020, 2021, dan 2020(Disajikan dalam ribuan dolar Amerika Serikat, kecuali dinyatakan lain)NOTES TO THE CONSOLIDATEDFINANCIAL STATEMENTSAs of December 31, 2022, 2021, and 2020and For The Years Ended December 31, 2022, 2021, and 2020 (Expressed in thousands of United States dollars,unless otherwise stated)46. INFORMASI SEGMEN (lanjutan) 46. SEGMENT INFORMATION (continued)2. Operasi lainnya (lanjutan) 2. Other operations (continued) 31 Desember/December 31, 2020 Eksplorasi dan produksi minyak Jumlah dan gas/ sebelum Exploration for eliminasi/ and production Jasa/ Total before Eliminasi/ Jumlah/ of oil and gas Services elimination Elimination Total PENDAPATAN REVENUESPendapatan 7.727.786 751.384 8.479.170 (405.376) 8.073.794 Revenues Beban segmen Segment expenses Beban pokok pendapatan (3.263.121) (594.209) (3.857.330) 397.574 (3.459.756) Cost of revenues Salaries and employees%u2019Biaya gaji upah dan tunjangan (201.389) (22.395) (223.784) - (223.784) benefitsBiaya pemeliharaan (333) - (333) - (333) Repairs and maintenance Beban depresiasi, deplesi (2.131.089) (82.870) (2.213.959) 44.458 (2.169.501) Depreciation, depletion, and dan amortisasi amotisation expensesLain - lain (144.366) (8.785) (153.151) - (153.151) Others Jumlah beban segmen (5.740.298) (708.259) (6.448.557) 442.032 (6.006.525) Total segment expenses Laba segmen 1.987.488 43.125 2.030.613 36.656 2.067.269 Segment profit Penyisihan penurunan nilai Provision for impairment of aset non-keuangan (662.684) - (662.684) - (662.684) non-financial assets Pendapatan/(beban) lain-lain, neto 554.748 3.696 558.444 (542.237) 16.207 Other income/(expense), netLaba operasi 1.879.552 46.821 1.926.373 (505.581) 1.420.792 Operating profit Penghasilan keuangan 41.553 4.368 45.921 - 45.921 Finance income Beban keuangan (148.872) (16.203) (165.075) - (165.075) Finance costs Keuntungan/(kerugian) selisih Foreign exchange kurs, neto 10.106 (2.840) 7.266 (5.929) 1.337 gain/(loss), net Laba sebelum Profit before pajak penghasilan 1.782.339 32.146 1.814.485 (511.510) 1.302.975 income taxesINFORMASI LAINNYA OTHER INFORMATION Aset segmen 49.925.528 1.098.315 51.023.843 (49.784.713) 1.239.130 Segment assets Aset Perusahaan dan entitas Unallocated assets anak yang tidak dapat of the Company dialokasikan 24.866.029 - 24.866.029 - 24.866.029 and subsidiaries Total aset yang Total consolidated dikonsolidasikan 74.791.557 1.098.315 75.889.872 (49.784.713) 26.105.159 assetsLiabilitas segmen 35.744.061 533.633 36.277.694 (49.195.430) (12.917.736) Segment liabilitiesLiabilitas Perusahaan dan Unallocated liabilities entitas anak yang tidak dapat of the Company dialokasikan 24.840.905 - 24.840.905 - 24.840.905 and subsidiaries Total liabilitas yang Total consolidated dikonsolidasikan 60.584.966 533.633 61.118.599 (49.195.430) 11.923.169 liabilities
