
Page 189 - Demo
P. 189
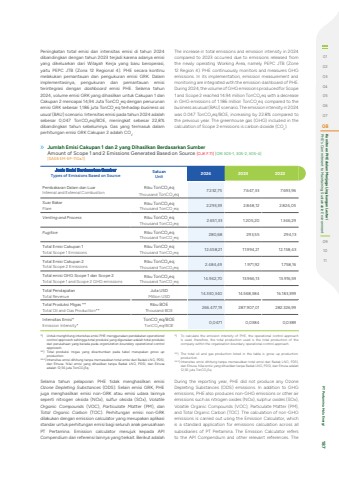
Peningkatan total emisi dan intensitas emisi di tahun 2024 dibandingkan dengan tahun 2023 terjadi karena adanya emisi yang dikeluarkan dari Wilayah Kerja yang baru beroperasi, yaitu PEPC JTB (Zona 12 Regional 4). PHE secara kontinu melakukan pemantauan dan pengukuran emisi GRK. Dalam implementasinya, pengukuran dan pemantauan emisi terintegrasi dengan dashboard emisi PHE. Selama tahun 2024, volume emisi GRK yang dihasilkan untuk Cakupan 1 dan Cakupan 2 mencapai 14,94 Juta TonCO2eq dengan penurunan emisi GRK sebesar 1,186 juta TonCO2eq terhadap business as usual (BAU) scenario. Intensitas emisi pada tahun 2024 adalah sebesar 0,047 TonCO2eq/BOE, meningkat sebesar 22,8% dibandingkan tahun sebelumnya. Gas yang termasuk dalam perhitungan emisi GRK Cakupan 2 adalah CO2.Jumlah Emisi Cakupan 1 dan 2 yang Dihasilkan Berdasarkan Sumber Amount of Scope 1 and 2 Emissions Generated Based on Source [OJK F.11] [GRI 305-1, 305-2, 305-4][SASB EM-EP-110a.1]Jenis Emisi Berdasarkan Sumber Types of Emissions Based on SourceSatuanUnit 2024 2023 2022Pembakaran Dalam dan LuarInternal and External CombustionRibu TonCO2eqThousand TonCO2eq7.232,75 7.647,33 7.693,96Suar BakarFlareRibu TonCO2eqThousand TonCO2eq2.293,39 2.848,12 2.824,05Venting and Process Ribu TonCO2eqThousand TonCO2eq2.651,33 1.205,20 1.346,29Fugitive Ribu TonCO2eqThousand TonCO2eq280,68 293,55 294,13Total Emisi Cakupan 1Total Scope 1 Emissions Ribu TonCO2eqThousand TonCO2eq12.458,21 11.994,21 12.158,43Total Emisi Cakupan 2Total Scope 2 EmissionsRibu TonCO2eqThousand TonCO2eq2.484,49 1.971,92 1.758,16Total emisi GHG Scope 1 dan Scope 2Total Scope 1 and Scope 2 GHG emissionsRibu TonCO2eqThousand TonCO2eq14.942,70 13.966,13 13.916,59Total PendapatanTotal RevenueJuta USDMillion USD 14.330,340 14.568,384 16.183,399Total Produksi Migas **Total Oil and Gas Production**Ribu BOEThousand BOE 266.477,19 287.907,01 282.326,99Intensitas Emisi*Emission Intensity*TonCO2eq/BOETonCO2eq/BOE 0,0471 0,0384 0,0389*) Untuk menghitung intensitas emisi PHE menggunakan pendekatan operational control approach sehingga total produksi yang digunakan adalah total produksi dari perusahaan yang berada pada organization boundary operational control approach.**) Total produksi migas yang dicantumkan pada tabel merupakan gross up production.***)Intensitas emisi dihitung tanpa memasukkan total emisi dari Badak LNG, PDSI, dan Elnusa. Nilai emisi yang dihasilkan tanpa Badak LNG, PDSI, dan Elnusa adalah 12,56 juta TonCO2Eq.*) To calculate the emission intensity of PHE, the operational control approachis used, therefore, the total production used is the total production of the company within the organization boundary operational control approach.**) The total oil and gas production listed in the table is gross up production. production.***)Intensitas emisi dihitung tanpa memasukkan total emisi dari Badak LNG, PDSI,dan Elnusa. Nilai emisi yang dihasilkan tanpa Badak LNG, PDSI, dan Elnusa adalah 12,56 juta TonCO2Eq.Selama tahun pelaporan PHE tidak menghasilkan emisi Ozone Depleting Substances (ODS). Selain emisi GRK, PHE juga menghasilkan emisi non-GRK atau emisi udara lainnya seperti nitrogen oksida (NOx), sulfur oksida (SOx), Volatile Organic Compounds (VOC), Particulate Matter (PM), dan Total Organic Carbon (TOC). Perhitungan emisi non-GRK dilakukan dengan emission calculator yang merupakan aplikasi standar untuk perhitungan emisi bagi seluruh anak perusahaan PT Pertamina. Emission calculator merujuk kepada API Compendium dan referensi lainnya yang terkait. Berikut adalah The increase in total emissions and emission intensity in 2024 compared to 2023 occurred due to emissions released from the newly operating Working Area, namely PEPC JTB (Zone 12 Region 4). PHE continuously monitors and measures GHG emissions. In its implementation, emission measurement and monitoring are integrated with the emission dashboard of PHE. During 2024, the volume of GHG emissions produced for Scope 1 and Scope 2 reached 14.94 million TonCO2eq with a decrease in GHG emissions of 1.186 million TonCO2eq compared to the business as usual (BAU) scenario. The emission intensity in 2024 was 0.047 TonCO2eq/BOE, increasing by 22.8% compared to the previous year. The greenhouse gas (GHG) included in the calculation of Scope 2 emissions is carbon dioxide (CO2).During the reporting year, PHE did not produce any Ozone Depleting Substances (ODS) emissions. In addition to GHG emissions, PHE also produces non-GHG emissions or other air emissions such as nitrogen oxides (NOx), sulphur oxides (SOx), Volatile Organic Compounds (VOC), Particulate Matter (PM), and Total Organic Carbon (TOC). The calculation of non-GHG emissions is carried out using the Emission Calculator, which is a standard application for emissions calculation across all subsidiaries of PT Pertamina. The Emission Calculator refers to the API Compendium and other relevant references. The 0102030405060708 PHE's Commitment to Maintaining Sustainable Environment Komitmen PHE dalam Menjaga Lingkungan Lestari091011 PT Pertamina Hulu Energi 187
