
Page 433 - Demo
P. 433
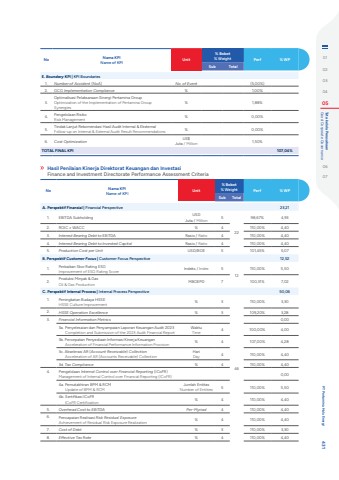
No Nama KPIName of KPI Unit% Bobot% Weight Perf % WPSub TotalA. Perspektif Finansial | Financial Perspective 23,211. EBITDA Subholding USD Juta / Million 52298,67% 4,932. ROIC %u2265 WACC % 4 110,00% 4,403. Interest Bearing Debt to EBITDA Rasio / Ratio 4 110,00% 4,404. Interest Bearing Debt to Invested Capital Rasio / Ratio 4 110,00% 4,405. Production Cost per Unit USD/BOE 5 101,45% 5,07B. Perspektif Customer Focus | Customer Focus Perspective 12,521. Perbaikan Skor Rating ESGImprovement of ESG Rating Score Indeks / Index 512110,00% 5,502. Produksi Minyak & GasOil & Gas Production MBOEPD 7 100,31% 7,02C. Perspektif Internal Process | Internal Process Perspective 50,061. Peningkatan Budaya HSSEHSSE Culture Improvement % 346110,00% 3,302. HSSE Operation Excellence % 3 109,20% 3,283. Financial Information Metrics 0,003a. Penyelesaian dan Penyampaian Laporan Keuangan Audit 2023Completion and Submission of the 2023 Audit Financial ReportWaktuTime 4 100,00% 4,003b. Percepatan Penyediaan Informasi Kinerja KeuanganAcceleration of Financial Performance Information Provision % 4 107,00% 4,283c. Akselerasi AR (Account Receivable) CollectionAcceleration of AR (Accounts Receivable) CollectionHariDay 4 110,00% 4,403d. Tax Compliance % 4 110,00% 4,404. Pengelolaan Internal Control over Financial Reporting (ICoFR)Management of Internal Control over Financial Reporting (ICoFR) 0,004a. Pemutakhiran BPM & RCMUpdate of BPM & RCMJumlah EntitasNumber of Entities 5 110,00% 5,504b. Sertifikasi ICoFRICoFR Certification % 4 110,00% 4,405. Overhead Cost to EBITDA Per-Myriad 4 110,00% 4,406. Pencapaian Realisasi Risk Residual ExposureAchievement of Residual Risk Exposure Realization % 4 110,00% 4,407. Cost of Debt % 3 110,00% 3,308. Effective Tax Rate % 4 110,00% 4,40Hasil Penilaian Kinerja Direktorat Keuangan dan Investasi Finance and Investment Directorate Performance Assessment CriteriaNo Nama KPIName of KPI Unit% Bobot% Weight Perf % WPSub TotalE. Boundary KPI | KPI Boundaries1. Number of Accident (NoA) No. of Event (5,00%)2. GCG Implementation Compliance % 1,00%3.Optimalisasi Pelaksanaan Sinergi Pertamina GroupOptimization of the Implementation of Pertamina Group Synergies% 1,88%4. Pengelolaan RisikoRisk Management % 0,00%5. Tindak Lanjut Rekomendasi Hasil Audit Internal & Eksternal Follow-up on Internal & External Audit Result Recommendations % 0,00%6. Cost Optimization US$ Juta / Million 1,50%TOTAL FINAL KPI 107,04%0102030405 Good Corporate Governance Tata kelola Perusahaan0607 PT Pertamina Hulu Energi 431
