
Page 431 - Demo
P. 431
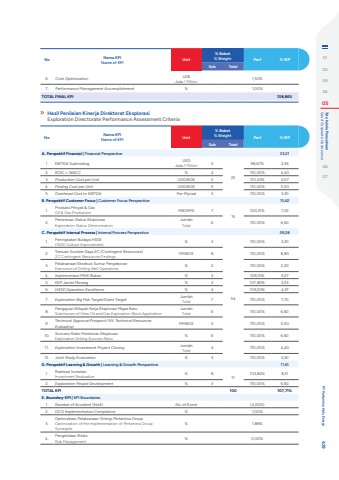
No Nama KPIName of KPI Unit% Bobot% Weight Perf % WPSub TotalA. Perspektif Finansial | Financial Perspective 23,211. EBITDA Subholding USD Juta / Million 52298,67% 4,932. ROIC %u2265 WACC % 4 110,00% 4,403. Production Cost per Unit USD/BOE 5 101,45% 5,074. Finding Cost per Unit USD/BOE 5 110,00% 5,505. Overhead Cost to EBITDA Per-Myriad 3 110,00% 3,30B. Perspektif Customer Focus | Customer Focus Perspective 13,621. Produksi Minyak & GasOil & Gas Production MBOEPD 713100,31% 7,022. Penentuan Status EksplorasiExploration Status DeterminationJumlahTotal 6 110,00% 6,60C. Perspektif Internal Process | Internal Process Perspective 59,281. Peningkatan Budaya HSSEHSSE Culture Improvement % 354110,00% 3,302. Temuan Sumber Daya 2C (Contingent Resources)2C Contingent Resources Findings MMBOE 8 110,00% 8,803. Pelaksanaan Eksekusi Sumur PengeboranExecution of Drilling Well Operations % 2 110,00% 2,204. Implementasi MNK Rokan % 3 109,10% 3,275. KKP Jambi Merang % 3 107,80% 3,236. HSSE Operation Excellence % 4 109,20% 4,377. Exploration Big Fish Target/Giant Target JumlahTotal 7 110,00% 7,708. Pengajuan Wilayah Kerja Eksplorasi Migas BaruSubmission of New Oil and Gas Exploration Block ApplicationJumlahTotal 6 110,00% 6,609. Technical Approval Prospect/ NV Technical Resources Evaluation MMBOE 5 110,00% 5,5010. Success Ratio Pemboran EksplorasiExploration Drilling Success Ratio % 6 110,00% 6,6011. Exploration Investment Project Closing JumlahTotal 4 110,00% 4,4012. Joint Study Evaluation % 3 110,00% 3,30D. Perspektif Learning & Growth | Learning & Growth Perspective 11,611. Realisasi InvestasiInvestment Realization % 811103,84% 8,312. Exploration People Development % 3 110,00% 6,60TOTAL KPI 100 107,71%E. Boundary KPI | KPI Boundaries1. Number of Accident (NoA) No. of Event (4,00%)2. GCG Implementation Compliance % 1,00%3.Optimalisasi Pelaksanaan Sinergi Pertamina GroupOptimization of the Implementation of Pertamina Group Synergies% 1,88%4. Pengelolaan RisikoRisk Management % 0,00%Hasil Penilaian Kinerja Direktorat EksplorasiExploration Directorate Performance Assessment CriteriaNo Nama KPIName of KPI Unit% Bobot% Weight Perf % WPSub Total6. Cost Optimization US$ Juta / Million 1,50%7. Performance Management Accomplishment % 1,00%TOTAL FINAL KPI 108,86%0102030405 Good Corporate Governance Tata kelola Perusahaan0607 PT Pertamina Hulu Energi 429
