
Page 387 - Demo
P. 387
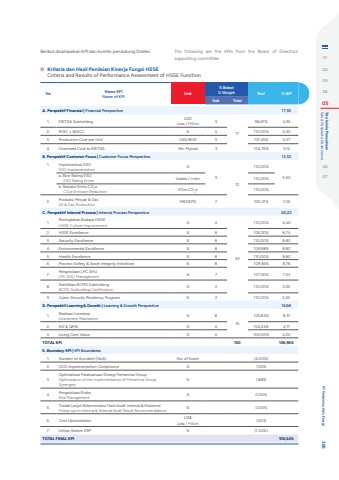
Kriteria dan Hasil Penilaian Kinerja Fungsi HSSECriteria and Results of Performance Assessment of HSSE Function Berikut disampaikan KPI dari komite pendukung Direksi. The following are the KPIs from the Board of Directors' supporting committee.No Nama KPIName of KPI Unit% Bobot% Weight Perf % WPSub TotalA. Perspektif Finansial | Financial Perspective 17,551. EBITDA Subholding USDJuta / Million 51798,67% 4,932. ROIC %u2265 WACC % 4 110,00% 4,403. Production Cost per Unit USD/BOE 5 101,45% 5,074. Overhead Cost to EBITDA Per-Myriad 3 104,76% 3,14B. Perspektif Customer Focus | Customer Focus Perspective 12,521. Implementasi ESGESG Implementation %512110,00%5,50 a. Skor Rating ESGESG Rating Score Indeks / Index 110,00%b. Reduksi Emisi CO2eCO2e Emission Reduction KTon CO2e 110,00%2. Produksi Minyak & GasOil & Gas Production MBOEPD 7 100,31% 7,02C. Perspektif Internal Process | Internal Process Perspective 60,221. Peningkatan Budaya HSSEHSSE Culture Improvement % 455110,00% 4,402. HSSE Excellence % 8 109,20% 8,743. Security Excellence % 8 110,00% 8,804. Environmental Excellence % 8 109,98% 8,805. Health Excellence % 8 110,00% 8,806. Process Safety & Asset Integrity Initiatives % 8 109,46% 8,767. Pengelolaan LPC SHULPC SHU Management % 7 107,50% 7,538. Sertifikasi BCMS SubholdingBCMS Subholding Certification % 2 110,00% 2,209. Cyber Security Resiliency Program % 2 110,00% 2,20D. Perspektif Learning & Growth | Learning & Growth Perspective 16,681. Realisasi Investasi Investment Realization % 816103,84% 8,312. KSI & QMA % 4 104,24% 4,173. Living Core Value % 4 105,00% 4,20TOTAL KPI 100 106,96%E. Boundary KPI | KPI Boundaries1. Number of Accident (NoA) No. of Event (4,00%)2. GCG Implementation Compliance % 1,00%3.Optimalisasi Pelaksanaan Sinergi Pertamina GroupOptimization of the Implementation of Pertamina Group Synergies% 1,88%4. Pengelolaan RisikoRisk Management % 0,00%5. Tindak Lanjut Rekomendasi Hasil Audit Internal & Eksternal Follow-up on Internal & External Audit Result Recommendations % 0,00%6. Cost Optimization US$Juta / Million 1,50%7. Utilasi Sistem ERP % (1,00%)TOTAL FINAL KPI 106,34%0102030405 Good Corporate Governance Tata kelola Perusahaan0607 PT Pertamina Hulu Energi 385
