
Page 217 - Demo
P. 217
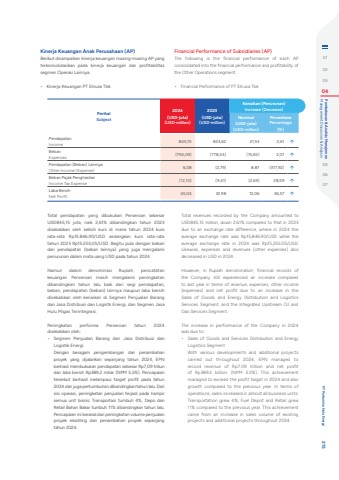
Financial Performance of Subsidiaries (AP)The following is the financial performance of each AP consolidated into the financial performance and profitability of the Other Operations segment.%u2022 Financial Performance of PT Elnusa TbkPerihalSubject2024(USD-juta)(USD-million)2023(USD-juta)(USD-million)Kenaikan (Penurunan)Increase (Decrease)Nominal(USD-juta)(USD-million)PersentasePercentage(%)PendapatanIncome 845,15 823,62 21,53 2,61 %uf0e1BebanExpenses (794,09) (778,44) (15,65) 2,01 %uf0e1Pendapatan (Beban) LainnyaOther Income (Expense) 6,08 (2,79) 8,87 (317,92) %uf0e1Beban Pajak PenghasilanIncome Tax Expense (12,10) (9,41) (2,69) 28,59 %uf0e1Laba BersihNet Profit 45,04 32,98 12,06 36,57 %uf0e1Kinerja Keuangan Anak Perusahaan (AP)Berikut disampaikan kinerja keuangan masing-masing AP yang terkonsolidasikan pada kinerja keuangan dan profitabilitas segmen Operasi Lainnya.%u2022 Kinerja Keuangan PT Elnusa TbkTotal pendapatan yang dibukukan Perseroan sebesar USD845,15 juta, naik 2,61% dibandingkan tahun 2023 disebabkan oleh selisih kurs di mana tahun 2024 kurs rata-rata Rp15.846,90/USD sedangkan kurs rata-rata tahun 2023 Rp15.255,05/USD. Begitu pula dengan beban dan pendapatan (beban lainnya) yang juga mengalami penurunan dalam mata uang USD pada tahun 2024. Namun dalam denominasi Rupiah, pencatatan keuangan Perseroan masih mengalami peningkatan dibandingkan tahun lalu baik dari segi pendapatan, beban, pendapatan (beban) lainnya maupun laba bersih disebabkan oleh kenaikan di Segmen Penjualan Barang dan Jasa Distribusi dan Logistk Energi, dan Segmen Jasa Hulu Migas Terintegrasi. Peningkatan performa Perseroan tahun 2024 disebabkan oleh:%u2022 Segmen Penjualan Barang dan Jasa Distribusi dan Logistik EnergiDengan beragam pengembangan dan penambahan proyek yang dijalankan sepanjang tahun 2024, EPN berhasil membukukan pendapatan sebesar Rp7,09 triliun dan laba bersih Rp389,2 miliar (NPM 5,5%). Pencapaian tersebut berhasil melampaui target profit pada tahun 2024 dan juga pertumbuhan dibandingkan tahun lalu. Dari sisi operasi, peningkatan penjualan terjadi pada hampir semua unit bisnis: Transportasi tumbuh 4%, Depo dan Retail Bahan Bakar tumbuh 11% dibandingkan tahun lalu. Pencapaian ini berasal dari peningkatan volume penjualan proyek eksisting dan penambahan proyek sepanjang tahun 2024. Total revenues recorded by the Company amounted to USD845.15 million, down 2.61% compared to that in 2023 due to an exchange rate difference, where in 2024 the average exchange rate was Rp15,846.90/USD while the average exchange rate in 2023 was Rp15,255.05/USD. Likewise, expenses and revenues (other expenses) also decreased in USD in 2024.However, in Rupiah denomination, financial records of the Company still experienced an increase compared to last year in terms of revenue, expenses, other income (expenses) and net profit due to an increase in the Sales of Goods and Energy Distribution and Logistics Services Segment, and the Integrated Upstream Oil and Gas Services Segment.The increase in performance of the Company in 2024 was due to:%u2022 Sales of Goods and Services Distribution and Energy Logistics SegmentWith various developments and additional projects carried out throughout 2024, EPN managed to record revenue of Rp7.09 trillion and net profit of Rp389.2 billion. (NPM 5.5%). This achievement managed to exceed the profit target in 2024 and also growth compared to the previous year. In terms of operations, sales increased in almost all business units: Transportation grew 4%, Fuel Depot and Retail grew 11% compared to the previous year. This achievement came from an increase in sales volume of existing projects and additional projects throughout 2024.010203 04 Management Discussion & Analysis Pembahasan & Analisis Manajemen050607 PT Pertamina Hulu Energi 215
