
Page 266 - Demo
P. 266
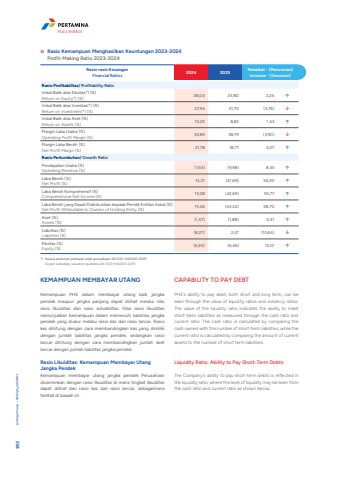
*) Sesuai pedoman penilaian anak perusahaan A6-002-H40000-2019.As per subsidiary valuation guideline A6-002-H40000-2019.Rasio Kemampuan Menghasilkan Keuntungan 2023-2024Profit-Making Ratio 2023-2024Rasio-rasio KeuanganFinancial Ratios 2024 2023 Kenaikan - (Penurunan)Increase - (Decrease)Rasio Profitabilitas/ Profitability RatioImbal Balik atas Ekuitas*) (%)Return on Equity*) (%) 26,04 23,80 2,24 %uf0e1Imbal Balik atas Investasi*) (%)Return on Investment*) (%) 27,94 31,70 (3,76) %uf0e2Imbal Balik atas Aset (%)Return on Assets (%) 10,25 8,82 1,43 %uf0e1Margin Laba Usaha (%)Operating Profit Margin (%) 34,89 38,79 (3,90) %uf0e2Margin Laba Bersih (%)Net Profit Margin (%) 21,78 18,71 3,07 %uf0e1Rasio Pertumbuhan/ Growth RatioPendapatan Usaha (%)Operating Revenue (%) (1,63) (9,98) 8,35 %uf0e1Laba Bersih (%)Net Profit (%) 14,51 (41,69) 56,20 %uf0e1Laba Bersih Komprehensif (%)Comprehensive Net Income (%) 13,08 (42,69) 55,77 %uf0e1Laba Bersih yang Dapat Diatribusikan kepada Pemilik Entitas Induk (%)Net Profit Attributable to Owners of Holding Entity (%) 15,46 (43,24) 58,70 %uf0e1Aset (%)Assets (%) (1,47) (1,88) 0,41 %uf0e1Liabilitas (%)Liabilities (%) (8,27) 2,37 (10,64) %uf0e2Ekuitas (%)Equity (%) (6,55) (6,46) 13,01 %uf0e1KEMAMPUAN MEMBAYAR UTANGKemampuan PHE dalam membayar utang baik jangka pendek maupun jangka panjang dapat dilihat melalui nilai rasio likuiditas dan rasio solvabilitas. Nilai rasio likuiditas menunjukkan kemampuan dalam memenuhi liabilitas jangka pendek yang diukur melalui rasio kas dan rasio lancar. Rasio kas dihitung dengan cara membandingkan kas yang dimiliki dengan jumlah liabilitas jangka pendek, sedangkan rasio lancar dihitung dengan cara membandingkan jumlah aset lancar dengan jumlah liabilitas jangka pendek.Rasio Likuiditas: Kemampuan Membayar Utang Jangka PendekKemampuan membayar utang jangka pendek Perusahaan dicerminkan dengan rasio likuiditas di mana tingkat likuiditas dapat dilihat dari rasio kas dan rasio lancar, sebagaimana terlihat di bawah ini. CAPABILITY TO PAY DEBTPHE's ability to pay debt, both short and long term, can be seen through the value of liquidity ratios and solvency ratios. The value of the liquidity ratio indicates the ability to meet short-term liabilities as measured through the cash ratio and current ratio. The cash ratio is calculated by comparing the cash owned with the number of short-term liabilities, while the current ratio is calculated by comparing the amount of current assets to the number of short term liabilities.Liquidity Ratio: Ability to Pay Short-Term DebtsThe Company's ability to pay short-term debts is reflected in the liquidity ratio, where the level of liquidity may be seen from the cash ratio and current ratio as shown below. Laporan Tahunan %u2022 Annual Report 264HULU ENERGI
