
Page 246 - Demo
P. 246
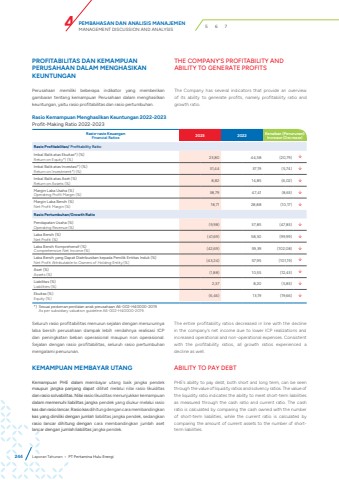
Rasio-rasio KeuanganFinancial Ratios 2023 2022 Kenaikan (Penurunan)Increase (Decrease)Rasio Profitabilitas/ Profitability RatioImbal Balik atas Ekuitas*) (%)Return on Equity*) (%) 23,80 44,58 (20,79) %uf0e2Imbal Balik atas Investasi*) (%)Return on Investment*) (%) 31,44 37,19 (5,74) %uf0e2Imbal Balik atas Aset (%)Return on Assets (%) 8,82 14,85 (6,02) %uf0e2Margin Laba Usaha (%)Operating Profit Margin (%) 38,79 47,41 (8,63) %uf0e2Margin Laba Bersih (%)Net Profit Margin (%) 18,71 28,88 (10,17) %uf0e2Rasio Pertumbuhan/Growth RatioPendapatan Usaha (%)Operating Revenue (%) (9,98) 37,85 (47,83) %uf0e2Laba Bersih (%)Net Profit (%) (41,69) 58,30 (99,99) %uf0e2Laba Bersih Komprehensif (%)Comprehensive Net Income (%) (42,69) 59,39 (102,08) %uf0e2Laba Bersih yang Dapat Diatribusikan kepada Pemilik Entitas Induk (%)Net Profit Attributable to Owners of Holding Entity (%) (43,24) 57,95 (101,19) %uf0e2Aset (%)Assets (%) (1,88) 10,55 (12,43) %uf0e2Liabilitas (%)Liabilities (%) 2,37 8,20 (5,83) %uf0e2Ekuitas (%)Equity (%) (6,46) 13,19 (19,66) %uf0e2*) Sesuai pedoman penilaian anak perusahaan A6-002-H40000-2019As per subsidiary valuation guideline A6-002-H40000-2019.Rasio Kemampuan Menghasilkan Keuntungan 2022-2023Profit-Making Ratio 2022-2023KEMAMPUAN MEMBAYAR UTANG ABILITY TO PAY DEBTKemampuan PHE dalam membayar utang baik jangka pendek maupun jangka panjang dapat dilihat melalui nilai rasio likuiditas dan rasio solvabilitas. Nilai rasio likuiditas menunjukkan kemampuan dalam memenuhi liabilitas jangka pendek yang diukur melalui rasio kas dan rasio lancar. Rasio kas dihitung dengan cara membandingkan kas yang dimiliki dengan jumlah liabilitas jangka pendek, sedangkan rasio lancar dihitung dengan cara membandingkan jumlah aset lancar dengan jumlah liabilitas jangka pendek.Seluruh rasio profitabilitas menurun sejalan dengan menurunnya laba bersih perusahaan dampak lebih rendahnya realisasi ICP dan peningkatan beban operasional maupun non operasional. Sejalan dengan rasio profitabilitas, seluruh rasio pertumbuhan mengalami penurunan.The entire profitability ratios decreased in line with the decline in the company%u2019s net income due to lower ICP realizations and increased operational and non-operational expenses. Consistent with the profitability ratios, all growth ratios experienced a decline as well.PHE%u2019s ability to pay debt, both short and long term, can be seen through the value of liquidity ratios and solvency ratios. The value of the liquidity ratio indicates the ability to meet short-term liabilities as measured through the cash ratio and current ratio. The cash ratio is calculated by comparing the cash owned with the number of short-term liabilities, while the current ratio is calculated by comparing the amount of current assets to the number of shortterm liabilities.PROFITABILITAS DAN KEMAMPUAN PERUSAHAAN DALAM MENGHASIKAN KEUNTUNGANPerusahaan memiliki beberapa indikator yang memberikan gambaran tentang kemampuan Perusahaan dalam menghasilkan keuntungan, yaitu rasio profitabilitas dan rasio pertumbuhan.THE COMPANY%u2019S PROFITABILITY AND ABILITY TO GENERATE PROFITSThe Company has several indicators that provide an overview of its ability to generate profits, namely profitability ratio and growth ratio.244 Laporan Tahunan %u2022 PT Pertamina Hulu EnergiPEMBAHASAN DAN ANALISIS MANAJEMENMANAGEMENT DISCUSSION AND ANALYSIS 4 5 6 7
