
Page 170 - Demo
P. 170
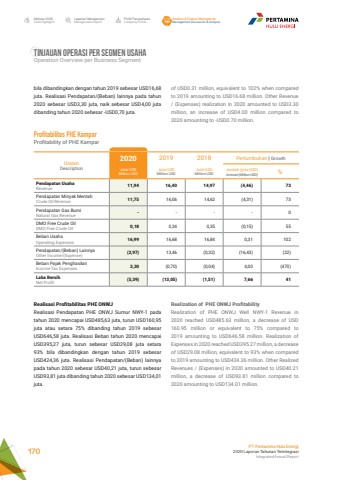
Laporan ManajemenManagement ReportProfil PerusahaanCompany ProfileAnalisa & Diskusi ManajemenManagement Discussion & AnalysisIkhtisar 20202020 HighlightsPT Pertamina Hulu Energi2020 Laporan Tahunan TerintegrasiIntegrated Annual Report 170of USD0.31 million, equivalent to 102% when compared to 2019 amounting to USD16.68 million. Other Revenue / (Expenses) realization in 2020 amounted to USD3.30 million, an increase of USD4.00 million compared to 2020 amounting to -USD0.70 million.Realization of PHE ONWJ ProfitabilityRealization of PHE ONWJ Well NWY-1 Revenue in 2020 reached USD485.63 million, a decrease of USD 160.95 million or equivalent to 75% compared to 2019 amounting to USD646.58 million. Realization of Expenses in 2020 reached USD395.27 million, a decrease of USD29.08 million, equivalent to 93% when compared to 2019 amounting to USD424.36 million. Other Realized Revenues / (Expenses) in 2020 amounted to USD40.21 million, a decrease of USD93.81 million compared to 2020 amounting to USD134.01 million.bila dibandingkan dengan tahun 2019 sebesar USD16,68 juta. Realisasi Pendapatan/(Beban) lainnya pada tahun 2020 sebesar USD3,30 juta, naik sebesar USD4,00 juta dibanding tahun 2020 sebesar -USD0,70 juta.Profitabilitas PHE Kampar Profitability of PHE KamparUraianDescription2020 2019 2018 Pertumbuhan | GrowthJuta USDMillion USDJuta USDMillion USDJuta USDMillion USDJumlah (juta USD)Amount (Million USD) %Pendapatan UsahaRevenue 11,94 16,40 14,97 (4,46) 73Pendapatan Minyak MentahCrude Oil Revenue 11,75 16,06 14,62 (4,31) 73Pendapatan Gas BumiNatural Gas Revenue - - - - 0DMO Free Crude OilDMO Free Crude Oil 0,18 0,34 0,35 (0,15) 55Beban UsahaOperating Expenses 16,99 16,68 16,84 0,31 102Pendapatan/(Beban) LainnyaOther Income/(Expense) (2,97) 13,46 (0,32) (16,43) (22)Beban Pajak PenghasilanIncome Tax Expenses 3,30 (0,70) (0,04) 4,00 (470)Laba BersihNet Profit (5,39) (13,05) (1,51) 7,66 41Realisasi Profitabilitas PHE ONWJRealisasi Pendapatan PHE ONWJ Sumur NWY-1 pada tahun 2020 mencapai USD485,63 juta, turun USD160,95 juta atau setara 75% dibanding tahun 2019 sebesar USD646,58 juta. Realisasi Beban tahun 2020 mencapai USD395,27 juta, turun sebesar USD29,08 juta setara 93% bila dibandingkan dengan tahun 2019 sebesar USD424,36 juta. Realisasi Pendapatan/(Beban) lainnya pada tahun 2020 sebesar USD40,21 juta, turun sebesar USD93,81 juta dibanding tahun 2020 sebesar USD134,01 juta.TINJAUAN OPERASI PER SEGMEN USAHA Operation Overview per Business Segment
