
Page 887 - Demo
P. 887
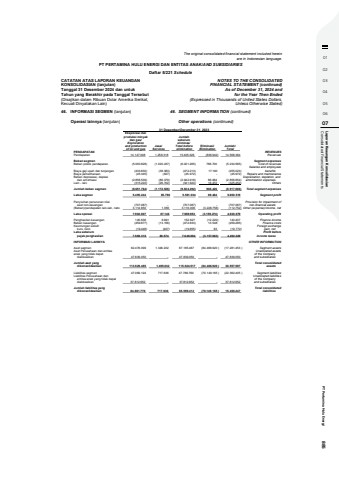
01020304050607 Consolidated Financial Statements Laporan Keaungan Konsolidasian PT Pertamina Hulu Energi 885The original consolidated financial statement included hereinare in Indonesian language.PT PERTAMINA HULU ENERGI DAN ENTITAS ANAK/AND SUBSIDIARIESDaftar 5/221 ScheduleCATATAN ATAS LAPORAN KEUANGANKONSOLIDASIAN (lanjutan)Tanggal 31 Desember 2024 dan untukTahun yang Berakhir pada Tanggal Tersebut(Disajikan dalam Ribuan Dolar Amerika Serikat,Kecuali Dinyatakan Lain)NOTES TO THE CONSOLIDATEDFINANCIAL STATEMENT (continued)As of December 31, 2024 andfor the Year Then Ended(Expressed in Thousands of United States Dollars,Unless Otherwise Stated)46. INFORMASI SEGMEN (lanjutan) 46. SEGMENT INFORMATION (continued)Operasi lainnya (lanjutan) Other operations (continued) 31 Desember/December 31, 2023__________________ Eksplorasi dan produksi minyak Jumlahdan gas/ sebelumExploration eliminas/ and production Jasa/ Total before Eliminasi/ Jumlah/ of oil and gas Services elimination Elimination TotalPENDAPATAN REVENUESPendapatan 14.147.008 1.258.318 15.405.326 (836.942) 14.568.384 RevenuesBeban segmen Segment expensesBeban pokok pendapatan (5.000.828) (1.020.437) (6.021.265) 786.700 (5.234.565) Cost of revenuesSalaries and employeesBiaya gaji upah dan tunjangan (433.830) (38.383) (472.213) 17.190 (455.023) benefitsBiaya pemeliharaan (45.345) (627) (45.972) - (45.972) Repairs and maintenanceBeban depresiasi, deplesi Depreciation, depletion, and dan amortisasi (2.856.539) (86.379) (2.942.918) 86.064 (2.856.854) amortization expensesLain - lain (315.222) (26.702) (341.924) 16.472 (325.452) OthersJumlah beban segmen (8.651.764) (1.172.528) (9.824.292) 906.426 (8.917.866) Total segment expensesLaba segmen 5.495.244 85.790 5.581.034 69.484 5.650.518 Segment profitPenyisihan penurunan nilai Provision for impairment of aset non-keuangan (707.087) - (707.087) - (707.087) non-financial assets(Beban)/pendapatan lain-lain, neto 3.114.650 1.356 3.116.006 (3.228.758) (112.752) Other (expense)/income, netLaba operasi 7.902.807 87.146 7.989.953 (3.159.274) 4.830.679 Operating profitPenghasilan keuangan 145.636 6.991 152.627 (12.220) 140.407 Finance incomeBeban keuangan (459.677) (13.156) (472.833) 13.548 (459.285) Finance costsKeuntungan selisih Foreign exchangekurs, neto (19.448) (407) (19.855) 83 (19.772) gain, netLaba sebelum Profit before pajak penghasilan 7.569.318 80.574 7.649.892 (3.157.863) 4.492.029 income taxesINFORMASI LAINNYA OTHER INFORMATIONAset segmen 62.476.099 1.346.202 67.185.467 (84.466.920 ) (17.281.453 ) Segment assetsAset Perusahaan dan entitas Unallocated assetsanak yang tidak dapat of the Company dialokasikan 47.839.050 - 47.839.050 - 47.839.050 and subsidiariesJumlah aset yang Total consolidated dikonsolidasikan 113.529.485 1.495.032 115.024.517 (84.466.920 ) 30.557.597 assetsLiabilitas segmen 47.069.124 717.636 47.786.760 (70.149.165 ) (22.362.405 ) Segment liabilitiesLiabilitas Perusahaan dan Unallocated liabilities entitas anak yang tidak dapat of the Company dialokasikan 37.812.652 - 37.812.652 - 37.812.652 and subsidiariesJumlah liabilitas yang Total consolidated dikonsolidasikan 84.881.776 717.636 85.599.412 (70.149.165 ) 15.450.247 liabilities
