
Page 18 - Demo
P. 18
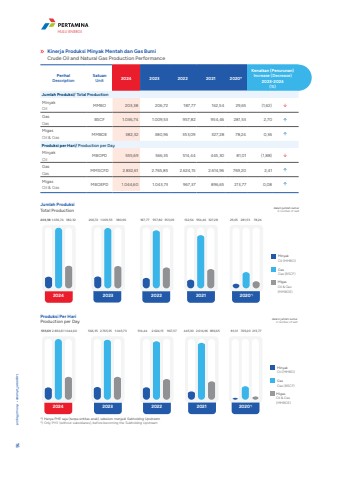
PerihalDescriptionSatuanUnit 2024 2023 2022 2021 2020*Kenaikan (Penurunan)Increase (Decrease)2023-2024(%)Jumlah Produksi/ Total ProductionMinyakOilMMBO 203,38 206,72 187,77 162,54 29,65 (1,62) %uf0e2GasGasBSCF 1.036,74 1.009,53 957,82 954,46 281,53 2,70 %uf0e1MigasOil & GasMMBOE 382,32 380,96 353,09 327,28 78,24 0,36 %uf0e1Produksi per Hari/ Production per DayMinyakOilMBOPD 555,69 566,35 514,44 445,30 81,01 (1,88) %uf0e2GasGasMMSCFD 2.832,61 2.765,85 2.624,15 2.614,96 769,20 2,41 %uf0e1MigasOil & GasMBOEPD 1.044,60 1.043,73 967,37 896,65 213,77 0,08 %uf0e1Jumlah ProduksiTotal Production dalam jumlah sumur in number of well203,38 1.036,74 382,32 206,72 1.009,53 380,96 187,77 957,82 353,09 162,54 954,46 327,28 29,65 281,53 78,24Minyak Oil (MMBO)GasGas (BSCF)MIgasOil & Gas(MMBOE)2024 2023 2022 2021 2020*)Produksi Per HariProduction per Day dalam jumlah sumur in number of well555,69 2.832,61 1.044,60 566,35 2.765,35 1.043,73 514,44 2.624,15 967,37 445,30 2.614,96 896,65 81,01 769,20 213,77Minyak Oil (MMBO)GasGas (BSCF)MIgasOil & Gas(MMBOE)2024 2023 2022 2021 2020*)Kinerja Produksi Minyak Mentah dan Gas BumiCrude Oil and Natural Gas Production Performance*) Hanya PHE saja (tanpa entitas anak), sebelum menjadi Subholding Upstream*) Only PHE (without subsidiaries), before becoming the Subholding UpstreamLaporan Tahunan %u2022 Annual Report 16PT Pertamina Hulu Energi 17HULU ENERGI
