
Page 25 - Demo
P. 25
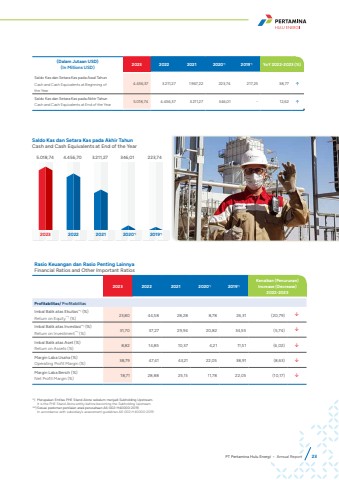
PT Pertamina Hulu Energi %u2022 Annual Report 23Jumlah Liabilitas (USD-juta)Total Liability (USD-million)16.710,36 16.323,51 15.087,00 2.547,63 2.294,45 2023 2022 2021 2020*) 2019*)Jumlah Ekuitas (USD-juta)Total Equity (USD-million)14.178,56 15.158,28 13.391,59 2.773,73 2.831,95 2023 2022 2021 2020*) 2019*)2023 2022 2021 2020*) 2019*)Kenaikan (Penurunan)Increase (Decrease) 2022-2023 Profitabilitas/ ProfitabilitasImbal Balik atas Ekuitas**) (%)Return on Equity**) (%) 23,80 44,58 28,28 8,78 26,31 (20,79) %uf0e2Imbal Balik atas Investasi**) (%)Return on Investment**) (%) 31,70 37,27 29,94 20,82 34,55 (5,74) %uf0e2Imbal Balik atas Aset (%)Return on Assets (%) 8,82 14,85 10,37 4,21 11,51 (6,02) %uf0e2Margin Laba Usaha (%)Operating Profit Margin (%) 38,79 47,41 43,21 22,05 38,91 (8,63) %uf0e2Margin Laba Bersih (%)Net Profit Margin (%) 18,71 28,88 25,15 11,78 22,05 (10,17) %uf0e2Rasio Keuangan dan Rasio Penting LainnyaFinancial Ratios and Other Important RatiosSaldo Kas dan Setara Kas pada Akhir TahunCash and Cash Equivalents at End of the Year5.018,74 4.456,70 3.211,27 346,01 223,742023 2022 2021 2020*) 2019*)(Dalam Jutaan USD)(In Millions USD) 2023 2022 2021 2020*) 2019*) YoY 2022-2023 (%)Saldo Kas dan Setara Kas pada Awal TahunCash and Cash Equivalents at Beginning of the Year 4.456,37 3.211,27 1.967,22 223,74 217,25 38,77 %uf0e1Saldo Kas dan Setara Kas pada Akhir TahunCash and Cash Equivalents at End of the Year 5.018,74 4.456,37 3.211,27 346,01 - 12,62 %uf0e1*) Merupakan Entitas PHE Stand Alone sebelum menjadi Subholding Upstream.It is the PHE Stand Alone entity before becoming the Subholding Upstream.**)Sesuai pedoman penilaian anak perusahaan A6-002-H40000-2019.In accordance with subsidiary%u2019s assessment guidelines A6-002-H40000-2019.
