
Page 202 - Demo
P. 202
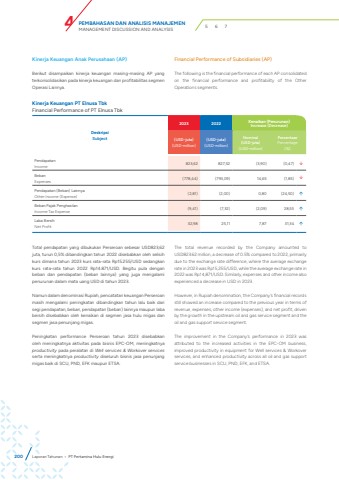
Total pendapatan yang dibukukan Perseroan sebesar USD823,62 juta, turun 0,5% dibandingkan tahun 2022 disebabkan oleh selisih kurs dimana tahun 2023 kurs rata-rata Rp15.255/USD sedangkan kurs rata-rata tahun 2022 Rp14.871/USD. Begitu pula dengan beban dan pendapatan (beban lainnya) yang juga mengalami penurunan dalam mata uang USD di tahun 2023.Namun dalam denominasi Rupiah, pencatatan keuangan Perseroan masih mengalami peningkatan dibandingkan tahun lalu baik dari segi pendapatan, beban, pendapatan (beban) lainnya maupun laba bersih disebabkan oleh kenaikan di segmen jasa hulu migas dan segmen jasa penunjang migas.Peningkatan performance Perseroan tahun 2023 disebabkan oleh meningkatnya aktivitas pada bisnis EPC-OM, meningkatnya productivity pada peralatan di Well services & Workover servicesserta meningkatnya productivity diseluruh bisnis jasa penunjang migas baik di SCU, PND, EFK maupun ETSA. The total revenue recorded by the Company amounted to USD823.62 million, a decrease of 0.5% compared to 2022, primarily due to the exchange rate difference, where the average exchange rate in 2023 was Rp15,255/USD, while the average exchange rate in 2022 was Rp14,871/USD. Similarly, expenses and other income also experienced a decrease in USD in 2023.However, in Rupiah denomination, the Company%u2019s financial records still showed an increase compared to the previous year in terms of revenue, expenses, other income (expenses), and net profit, driven by the growth in the upstream oil and gas service segment and the oil and gas support service segment.The improvement in the Company%u2019s performance in 2023 was attributed to the increased activities in the EPC-OM business, improved productivity in equipment for Well services & Workover services, and enhanced productivity across all oil and gas support service businesses in SCU, PND, EFK, and ETSA.Kinerja Keuangan PT Elnusa TbkFinancial Performance of PT Elnusa TbkDeskripsiSubject2023 2022 Kenaikan (Penurunan)Increase (Decrease)(USD-juta)(USD-million)(USD-juta)(USD-million)Nominal(USD-juta)(USD-million)PersentasePercentage(%)PendapatanIncome 823,62 827,52 (3,90) (0,47) %uf0e2BebanExpenses (778,44) (793,09) 14,65 (1,85) %uf0e2Pendapatan (Beban) LainnyaOther Income (Expense) (2,81) (2,00) 0,80 (24,50) %uf0e1Beban Pajak PenghasilanIncome Tax Expense (9,41) (7,32) (2,09) 28,55 %uf0e1Laba BersihNet Profit 32,98 25,11 7,87 31,34 %uf0e1Kinerja Keuangan Anak Perusahaan (AP)Berikut disampaikan kinerja keuangan masing-masing AP yang terkonsolidasikan pada kinerja keuangan dan profitabilitas segmen Operasi Lainnya.Financial Performance of Subsidiaries (AP)The following is the financial performance of each AP consolidated on the financial performance and profitability of the Other Operations segments.200 Laporan Tahunan %u2022 PT Pertamina Hulu EnergiPEMBAHASAN DAN ANALISIS MANAJEMENMANAGEMENT DISCUSSION AND ANALYSIS 4 5 6 7
