
Page 133 - Demo
P. 133
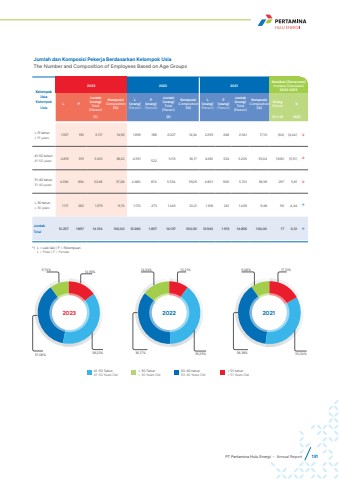
Jumlah dan Komposisi Pekerja Berdasarkan Kelompok UsiaThe Number and Composition of Employees Based on Age GroupsKelompok UsiaKelompok Usia2023 2022 2021Kenaikan (Penurunan) Increase (Decrease)2022-2023L PJumlah(orang)Total(Person)KomposisiComposition(%)L(orang)(Person)P(orang)(Person)Jumlah(orang)Total(Person)KomposisiComposition(%)L(orang)(Person)P(orang)(Person)Jumlah(orang)Total(Person)KomposisiComposition(%)OrangPerson %(1) (2) (3=1-2) (3/2)%u2265 51 tahun%u2265 51 years 1.927 190 2.117 14,96 1.839 188 2.027 14,34 2.293 248 2.541 17,10 (64) (4,44) %uf0e241-50 tahun41-50 years 4.819 591 5.410 38,22 4.591 522 5.113 36,17 4.681 524 5.205 35,04 (306) (5,51) %uf0e231-40 tahun31-40 years 4.394 854 5.248 37,08 4.680 874 5.554 39,29 4.801 900 5.701 38,38 297 5,81 %uf0e2%u2264 30 tahun%u2264 30 years 1.117 262 1.379 9,74 1.170 273 1.443 10,21 1.168 241 1.409 9,48 90 4,44 %uf0e1JumlahTotal 12.257 1.897 14.154 100,00 12.280 1.857 14.137 100,00 12.943 1.913 14.856 100,00 17 0,12 %uf0e1*) L = Laki-laki | P = PerempuanL = Male | P = Female41-50 Tahun41-50 Years Old< 30 Tahun< 30 Years Old30-40 tahun30-40 Years Old> 51 tahun> 51 Years Old14,96%38,22% 37,08%9,74%2023 202210,21%39,29% 36,17%14,34%202117,10%38,38% 35,04%9,48%PT Pertamina Hulu Energi %u2022 Annual Report 131
