
Page 23 - Demo
P. 23
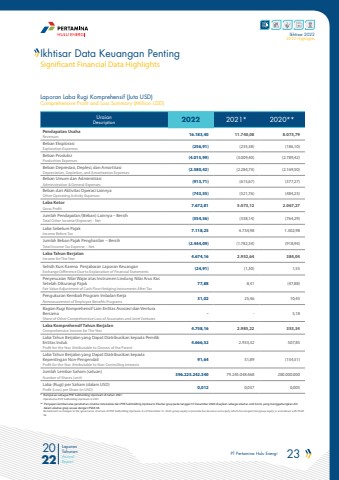
PT Pertamina Hulu Energi 23 2022Laporan TahunanAnnual ReportIkhtisar 20222022 HighlightsLaporan Laba Rugi Komprehensif (Juta USD) Comprehensive Profit and Loss Summary (Million USD)* Beroperasi sebagai PHE Subholding Upstream di tahun 2021. Operated as PHE Subholding Upstream in 2021** Penyajian kembali atas perubahan struktur tata kelola dari PHE Subholding Upstream. Ekuitas grup pada tanggal 31 Desember 2020 disajikan sebagai ekuitas unit bisnis yang menggabungkan diri dalam ekuitas grup sesuai dengan PSAK 38. Restatement as changes to the governance structure of PHE Subholding Upstream. As of December 31, 2020, group equity is presented as business unit equity which has merged into group equity in accordance with PSAK 38.Ikhtisar Data Keuangan PentingSignificant Financial Data HighlightsUraianDescription 2022 2021* 2020**Pendapatan UsahaRevenues 16.183,40 11.740,08 8.073,79Beban Eksplorasi Exploration Expenses (256,91) (235,38) (186,10)Beban Produksi Production Expenses (4.015,99) (3.009,40) (2.789,42)Beban Depresiasi, Deplesi, dan AmortisasiDepreciation, Depletion, and Amortization Expenses (2.580,42) (2.284,74) (2.169,50)Beban Umum dan AdministrasiAdministration & General Expenses (913,71) (615,67) (377,27)Beban dari Aktivitas Operasi LainnyaOther Operating Activity Expenses (743,55) (521,76) (484,23)Laba Kotor Gross Profit 7.672,81 5.073,12 2.067,27Jumlah Pendapatan/(Beban) Lainnya %u2013 BersihTotal Other Income/(Expense) - Net (554,56) (338,14) (764,29)Laba Sebelum Pajak Income Before Tax 7.118,25 4.734,98 1.302,98Jumlah Beban Pajak Penghasilan %u2013 BersihTotal Income Tax Expense %u2013 Net (2.444,09) (1.782,34) (918,94)Laba Tahun Berjalan Income for The Year 4.674,16 2.952,64 384,04Selisih Kurs Karena Penjabaran Laporan KeuanganExchange Difference Due to Explanation of Financial Statements (24,91) (1,30) 1,55Penyesuaian Nilai Wajar atas Instrumen Lindung Nilai Arus Kas Setelah Dikurangi PajakFair Value Adjustment of Cash Flow Hedging Instruments After Tax77,88 8,41 (47,88)Pengukuran Kembali Program Imbalan KerjaRemeasurement of Employee Benefits Programs 31,02 25,46 10,45Bagian Rugi Komprehensif Lain Entitas Asosiasi dan Ventura BersamaShare of Other Comprehensive Loss of Associates and Joint Ventures- - 5,18Laba Komprehensif Tahun BerjalanComprehensive Income for The Year 4.758,16 2.985,22 353,34Laba Tahun Berjalan yang Dapat Diatribusikan kepada Pemilik Entitas IndukProfit for the Year Attributable to Owners of the Parent4.666,52 2.933,32 507,85Laba Tahun Berjalan yang Dapat Diatribusikan kepada Kepentingan Non-PengendaliProfit for the Year Attributable to Non-Controlling Interests91,64 51,89 (154,51)Jumlah Lembar Saham (satuan) Number of Shares (unit) 396.225.242.340 79.245.048.468 200.000.000Laba (Rugi) per Saham (dalam USD)Profit (Loss) per Share (in USD) 0,012 0,037 0,005
