
Page 175 - Demo
P. 175
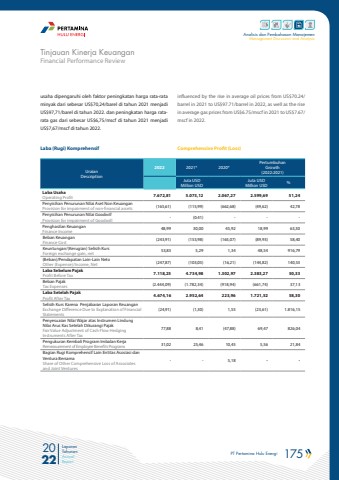
PT Pertamina Hulu Energi 175 2022Laporan TahunanAnnual ReportAnalisis dan Pembahasan ManajemenManagement Discussion and AnalysisFinancial Performance ReviewTinjauan Kinerja Keuanganinfluenced by the rise in average oil prices from US$70.24/barrel in 2021 to US$97.71/barrel in 2022, as well as the rise in average gas prices from US$6.75/mscf in 2021 to US$7.67/mscf in 2022.usaha dipengaruhi oleh faktor peningkatan harga rata-rata minyak dari sebesar US$70,24/barel di tahun 2021 menjadi US$97,71/barel di tahun 2022. dan peningkatan harga ratarata gas dari sebesar US$6,75/mscf di tahun 2021 menjadi US$7,67/mscf di tahun 2022.Laba (Rugi) Komprehensif Comprehensive Profit (Loss)UraianDescription2022 2021* 2020*PertumbuhanGrowth(2022:2021)Juta USDMillion USDJuta USDMillion USD %Laba UsahaOperating Profit 7.672,81 5.073,12 2.067,27 2.599,69 51,24Penyisihan Penurunan Nilai Aset Non KeuanganProvision for impairment of non-financial assets (165,61) (115,99) (662,68) (49,62) 42,78Penyisihan Penurunan Nilai GoodwillProvision for impairment of Goodwill - (0.41) - - -Penghasilan KeuanganFinance Income 48,99 30,00 45,92 18,99 63,30Beban KeuanganFinance Cost (243,91) (153,98) (165,07) (89,93) 58,40Keuntungan/(Kerugian) Selisih KursForeign exchange gain, net 53,83 5,29 1,34 48,54 916,79(Beban)/Pendapatan Lain-Lain NetoOther (Expense)/Income, Net (247,87) (103,05) (16,21) (144,82) 140,53Laba Sebelum PajakProfit Before Tax 7.118,25 4.734,98 1.302,97 2.383,27 50,33Beban PajakTax Expenses (2.444,09) (1.782,34) (918,94) (661,74) 37,13Laba Setelah PajakProfit After Tax 4.674,16 2.952,64 223,96 1.721,52 58,30Selisih Kurs Karena Penjabaran Laporan KeuanganExchange Difference Due to Explanation of Financial Statements(24,91) (1,30) 1,55 (23,61) 1.816,15Penyesuaian Nilai Wajar atas Instrumen Lindung Nilai Arus Kas Setelah Dikurangi PajakFair Value Adjustment of Cash Flow Hedging Instruments After Tax77,88 8,41 (47,88) 69,47 826,04Pengukuran Kembali Program Imbalan KerjaRemeasurement of Employee Benefits Programs 31,02 25,46 10,45 5,56 21,84Bagian Rugi Komprehensif Lain Entitas Asosiasi dan Ventura BersamaShare of Other Comprehensive Loss of Associates and Joint Ventures- - 5,18 - -
