
Page 260 - Demo
P. 260
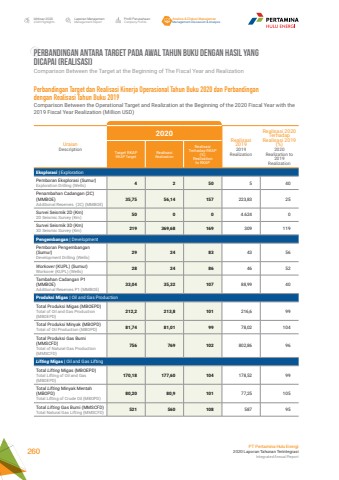
Laporan ManajemenManagement ReportProfil PerusahaanCompany ProfileAnalisa & Diskusi ManajemenManagement Discussion & AnalysisIkhtisar 20202020 HighlightsPT Pertamina Hulu Energi2020 Laporan Tahunan TerintegrasiIntegrated Annual Report 260PERBANDINGAN ANTARA TARGET PADA AWAL TAHUN BUKU DENGAN HASIL YANG DICAPAI (REALISASI)Comparison Between the Target at the Beginning of The Fiscal Year and RealizationUraianDescription2020Realisasi20192019 RealizationRealisasi 2020 Terhadap Realisasi 2019 (%)2020Realization to 2019RealizationTarget RKAPRKAP TargetRealisasiRealization Realisasi Terhadap RKAP (%)Realizationto RKAPEksplorasi | ExplorationPemboran Eksplorasi (Sumur)Exploration Drilling (Wells) 4 2 50 5 40Penambahan Cadangan (2C) (MMBOE)Additional Reserves (2C) (MMBOE)35,75 56,14 157 223,83 25Survei Seismik 2D (Km)2D Seismic Survey (Km) 50 0 0 4.624 0Survei Seismik 3D (Km)3D Seismic Survey (Km) 219 369,68 169 309 119Pengembangan | DevelopmentPemboran Pengembangan (Sumur)Development Drilling (Wells)29 24 83 43 56Workover (KUPL) (Sumur)Workover (KUPL) (Wells) 28 24 86 46 52Tambahan Cadangan P1 (MMBOE)Additional Reserves P1 (MMBOE)33,04 35,32 107 88,99 40Produksi Migas | Oil and Gas ProductionTotal Produksi Migas (MBOEPD)Total of Oil and Gas Production (MBOEPD)212,2 213,8 101 216,6 99Total Produksi Minyak (MBOPD)Total of Oil Production (MBOPD) 81,74 81,01 99 78,02 104Total Produksi Gas Bumi (MMSCFD)Total of Natural Gas Production (MMSCFD)756 769 102 802,86 96Lifting Migas | Oil and Gas LiftingTotal Lifting Migas (MBOEPD)Total Lifting of Oil and Gas (MBOEPD)170,18 177,60 104 178,52 99Total Lifting Minyak Mentah (MBOPD)Total Lifting of Crude Oil (MBOPD)80,20 80,9 101 77,25 105Total Lifting Gas Bumi (MMSCFD)Total Natural Gas Lifting (MMSCFD) 521 560 108 587 95Perbandingan Target dan Realisasi Kinerja Operasional Tahun Buku 2020 dan Perbandingan dengan Realisasi Tahun Buku 2019Comparison Between the Operational Target and Realization at the Beginning of the 2020 Fiscal Year with the 2019 Fiscal Year Realization (Million USD)
