
Page 242 - Demo
P. 242
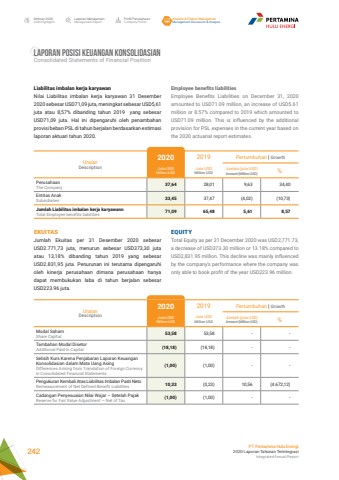
Laporan ManajemenManagement ReportProfil PerusahaanCompany ProfileAnalisa & Diskusi ManajemenManagement Discussion & AnalysisIkhtisar 20202020 HighlightsPT Pertamina Hulu Energi2020 Laporan Tahunan TerintegrasiIntegrated Annual Report 242Employee benefits liabilitiesEmployee Benefits Liabilities on December 31, 2020 amounted to USD71.09 million, an increase of USD5.61 million or 8.57% compared to 2019 which amounted to USD71.09 million. This is influenced by the additional provision for PSL expenses in the current year based on the 2020 actuarial report estimates.EQUITY Total Equity as per 31 December 2020 was USD2,771.73, a decrease of USD373.30 million or 13.18% compared to USD2,831.95 million. This decline was mainly influenced by the company%u2019s performance where the company was only able to book profit of the year USD223.96 million.LAPORAN POSISI KEUANGAN KONSOLIDASIANConsolidated Statements of Financial PositionLiabilitas imbalan kerja karyawanNilai Liabilitas imbalan kerja karyawan 31 Desember 2020 sebesar USD71,09 juta, meningkat sebesar USD5,61 juta atau 8,57% dibanding tahun 2019 yang sebesar USD71,09 juta. Hal ini dipengaruhi oleh penambahan provisi beban PSL di tahun berjalan berdasarkan estimasi laporan aktuari tahun 2020.UraianDescription2020 2019 Pertumbuhan | GrowthJuta USDMillion USDJuta USDMillion USDJumlah (juta USD)Amount (Million USD) %PerusahaanThe Company 37,64 28,01 9,63 34,40Entitas AnakSubsidiaries 33,45 37,47 (4,02) (10,73)Jumlah Liabilitas imbalan kerja karyawannTotal Employee benefits liabilities 71,09 65,48 5,61 8,57EKUITAS Jumlah Ekuitas per 31 Desember 2020 sebesar USD2.771,73 juta, menurun sebesar USD373,30 juta atau 13,18% dibanding tahun 2019 yang sebesar USD2.831,95 juta. Penurunan ini terutama dipengaruhi oleh kinerja perusahaan dimana perusahaan hanya dapat membukukan laba di tahun berjalan sebesar USD223.96 juta.UraianDescription2020 2019 Pertumbuhan | GrowthJuta USDMillion USDJuta USDMillion USDJumlah (juta USD)Amount (Million USD) %Modal SahamShare Capital 53,58 53,58 - -Tambahan Modal DisetorAdditional Paid-In Capital (18,18) (18,18) - -Selisih Kurs Karena Penjabaran Laporan Keuangan Konsolidasian dalam Mata Uang AsingDifferences Arising from Translation of Foreign Currency in Consolidated Financial Statements(1,00) (1,00) - -Pengukuran Kembali Atas Liabilitas Imbalan Pasti NetoRemeasurement of Net Defined Benefit Liabilities 10,33 (0,23) 10,56 (4.672,12)Cadangan Penyesuaian Nilai Wajar %u2013 Setelah PajakReserve for Fair Value Adjustment %u2014 Net of Tax (1,00) (1,00) - -
