
Page 203 - Demo
P. 203
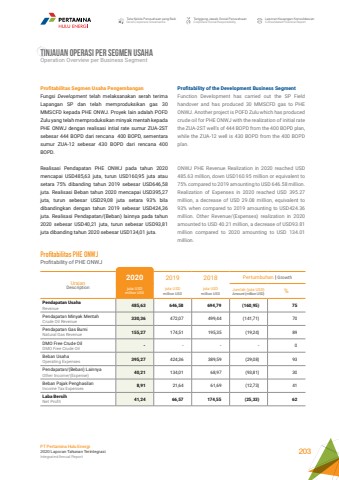
Tata Kelola Perusahaan yang BaikGood Corporate GovernanceTanggung Jawab Sosial PerusahaanCorporate Social ResponsibilityLaporan Keuangan KonsolidasianConsolidated Financial ReportPT Pertamina Hulu Energi2020 Laporan Tahunan TerintegrasiIntegrated Annual Report 203Profitability of the Development Business SegmentFunction Development has carried out the SP Field handover and has produced 30 MMSCFD gas to PHE ONWJ. Another project is POFD Zulu which has produced crude oil for PHE ONWJ with the realization of initial rate the ZUA-2ST well%u2019s of 444 BOPD from the 400 BOPD plan, while the ZUA-12 well is 430 BOPD from the 400 BOPD plan. ONWJ PHE Revenue Realization in 2020 reached USD 485.63 million, down USD160.95 million or equivalent to 75% compared to 2019 amounting to USD 646.58 million. Realization of Expenses in 2020 reached USD 395.27 million, a decrease of USD 29.08 million, equivalent to 93% when compared to 2019 amounting to USD424.36 million. Other Revenue/(Expenses) realization in 2020 amounted to USD 40.21 million, a decrease of USD93.81 million compared to 2020 amounting to USD 134.01 million.TINJAUAN OPERASI PER SEGMEN USAHA Operation Overview per Business SegmentProfitabilitas Segmen Usaha PengembanganFungsi Development telah melaksanakan serah terima Lapangan SP dan telah memproduksikan gas 30 MMSCFD kepada PHE ONWJ. Proyek lain adalah POFD Zulu yang telah memproduksikan minyak mentah kepada PHE ONWJ dengan realisasi intial rate sumur ZUA-2ST sebesar 444 BOPD dari rencana 400 BOPD, sementara sumur ZUA-12 sebesar 430 BOPD dari rencana 400 BOPD. Realisasi Pendapatan PHE ONWJ pada tahun 2020 mencapai USD485,63 juta, turun USD160,95 juta atau setara 75% dibanding tahun 2019 sebesar USD646,58 juta. Realisasi Beban tahun 2020 mencapai USD395,27 juta, turun sebesar USD29,08 juta setara 93% bila dibandingkan dengan tahun 2019 sebesar USD424,36 juta. Realisasi Pendapatan/(Beban) lainnya pada tahun 2020 sebesar USD40,21 juta, turun sebesar USD93,81 juta dibanding tahun 2020 sebesar USD134,01 juta.Profitabilitas PHE ONWJ Profitability of PHE ONWJUraianDescription2020 2019 2018 Pertumbuhan | Growthjuta USDmillion USDjuta USDmillion USDjuta USDmillion USDJumlah (juta USD)Amount (million USD) %Pendapatan UsahaRevenue 485,63 646,58 694,79 (160,95) 75Pendapatan Minyak MentahCrude Oil Revenue 330,36 472,07 499,44 (141,71) 70Pendapatan Gas BumiNatural Gas Revenue 155,27 174,51 195,35 (19,24) 89DMO Free Crude OilDMO Free Crude Oil - - - - 0Beban UsahaOperating Expenses 395,27 424,36 389,59 (29,08) 93Pendapatan/(Beban) LainnyaOther Income/(Expense) 40,21 134,01 68,97 (93,81) 30Beban Pajak PenghasilanIncome Tax Expenses 8,91 21,64 61,69 (12,73) 41Laba BersihNet Profit 41,24 66,57 174,55 (25,33) 62
